Wednesday, August 21, 2013

Aug. 21 - Haze hits the borderland today

If you looked outside this afternoon and looked up you would have noticed a light haze. Particularly noticeable later in the afternoon with the setting sun. A quick run of the Hysplit model in the backward mode showed the source region of the haze. Below is a backtrajectory map from Las Cruces examining the air 5 days in the past. The past 24-hour showed the air from the southeast along the Rio Grande. Going back even further the airmass made a turn along the path of the high pressure center and passed through the upper Midwest and through the northern Plains.
Knowing that there are numerous wildfires burning in the west and looking at the smoke plume analysis maps you can be fairly sure that the haze in our area is from those fires.

Saturday, June 29, 2013

June 29-

A haboob passed over the Paso del Norte and upward through Dona Ana County this evening. It was generated from an area of convection south of Cd. Juarez. Below is a animation of the radar reflectivities from about 7 pm to 9 pm tonight. The haboob shows up as the blue thread-like line wiggling north throughout the animation.

Thursday, June 27, 2013

June 27 -

The smoke here in Las Cruces wasn't as bad as expected this morning as this photo taken at 8am shows.
For the remainder of Thursday the smoke will probably be transported toward the west-southwest.
By late morning pyrocumulus could be seen from MODIS. Below is the Terra MODIS image from this morning with Hysplit predictions from the fire.
I could briefly see the pyrocumulus cloud from my office in Las Cruces at around noon while visibility was very good. A few cumulus clouds are making it harder to see now by 3 pm. As of 5 pm the smoke plume had traveled southwest into Arizona and covers most all of Hidalgo County.
 In other news, today's high temperatures were near record across the borderland today. So far the high at NMSU was 106F that I observed at 3:30pm. So far the high at the Las Cruces airport is 105F and also 105 at the El Paso airport ASOS KELP.


Wednesday, June 26, 2013

June 26 - Silver fire with substantial impacts to Las Cruces

June 26 -

Impacts from the Silver fire were substantial over Las Cruces today as winds were light and tended to follow the terrain. Below are wind streamlines at 8 am Wed. that show wind patterns causing the smoke to fill in the valley this morning. The streamlines point toward the southeast from the fire, draining toward lower elevation and along the Rio Grande.

Most of the smoke was elevated in the morning and above the shallow temperature inversion. The photo below was taken about 8:30am looking toward the Organ Mountains with the smoke thickest about half way up the slopes.
Yesterday we saw some smoke drifting in from the Silver fire and lift by evening. Below are hourly measurements of PM10 (blue line) and PM2.5 (red line) collected at the Fabian Garcia Horticulture farm on campus in Las Cruces. As of noon the Organ Mountains 10 miles away are obscured by the smoke from campus. As of 1:30pm the Las Cruces airport was observing 7 mile visibility.  Below are the PM10 and PM2.5 concentrations at the NMSU Las Cruces campus as of 9 pm.
We took a PM10 filter sample today to analyze particle morphology in addition to getting a mass concentration to compare with the continuous sampler. We ran the BGI PQ100 for just under 12 hours and also collected particles on a nuclepore filer for analysis with the electron microscope. Below is a representative image from the nuclepore filter during the smoke event today. Many of the particles looked similar to this one. I think this is a soot particle made up of many smaller monomer strands. Physical diameter was on the order of 10 microns. There were also particles that looked geological in nature and a few biological particles.
This morning the smoke was kept aloft above an inversion over Las Cruces. The CL31 ceilometer running as a backscatter lidar clearly allows us to visualize that. I highlighted the top of the layer when the backscatter signal was high starting around 5 am. By 11 am the smoke started to mix down toward the ground as the inversion broke up and caused PM2.5 concentrations to increase rapidly.
The forecast for smoke for Wednesday and into Thursday is for more impacts of the Silver fire in the area around the fire to include Las Cruces as shown in the map below.
I'm more concerned about the overnight smoke concentrations and early morning. The NOAA smoke forecast guidance maps show smoke settling in the Rio Grande valley and potentially causing high PM2.5 concentrations on Thursday morning, June 27. If you live in the area with shading, I would make sure your windows are closed tonight and turn off your swamp cooler if you have one.
Forward trajectories from the fire overnight are supporting this forecast. The trajectories in the map below are from the RAP 20km model run with a Hysplit ensemble at 500m starting height from 04Z to 21Z.


Tuesday, June 25, 2013

June 25 -

Westerly winds transported wildfires smoke toward the east today as seen from the NOAA HMS smoke product. The Mexican fires had less of an impact on New Mexican counties while the smoke was well south of the border today. The Silver fire has burned approximately 85,000 acres and at 20 percent containment.
Silver fire smoke forecasts from the fire community predict the plume to be transported east through Wednesday. Potentially unhealthy smoke impacts are predicted in the immediate area during the morning hours.
No relief in the form of precipitation is in the forecast for this week. However the experimental 7 day precipitation forecast is showing a chance for light amounts over part of southern NM by next Tuesday.


Sunday, June 23, 2013

June 23 - Impacts from wildfire smoke continue to impact the borderland.

Fires continue to burn in Mexico and bring smoke to New Mexico. Below is the NOAA HMS smoke product as of Sunday night. Fires across NM and CO fill the skies over much of central US today based on the map.
Looking a little closer using MODIS imagery from the Aqua satellite this afternoon you can see the individual smoke plumes from the Mexican fires impacting areas east of Lordsburg. Background image was from Univ. Wisconsin CIMSS/SSEC. The Silver fire plume continues to impact areas north of TorC in northern Sierra county.

Saturday, June 22, 2013

June 22 -

Downwind of wildfires in Mexico and nearby Silver fire in the Gila. We saw hazy skies along the border today with most of it attributable to the wildfires in Mexico due to the west to southwesterly winds blowing the smoke across the region. Below is shows the outlines of smoke plumes in white and locations of fires as the red dots from the NOAA HMS website.
Hysplit backtrajectories from the various populated areas just reinforce this smoke transport from the fires in Mexico.
 

Friday, June 21, 2013

June 21 -

I've done some traveling and missed a couple of events along the border while I was gone but gained some insight on the drought while traversing the Rio Grande from Taos.

The border air quality first event that I looked at that is worth mentioning was the night-time haboob on the early morning of June 20. Below is a radar animation of reflectivity starting just before midnight. Watch the outflow boundary move northward over time. Winds were high along the boundary and caused quite a bit of dust.
Smoke from fires in Mexico contribute to hazy skies on the 19, 20, and 21st. Below shows the outlines of smoke as provided by the NOAA HMS product today at 17:42 UTC (11:41 am).

Tuesday, June 18, 2013

June 18 -

Radar picked up rainfall on June 17 along the border area in addition to some thunderstorm outflow. I flew in last night at around 10:30 pm and the area around El Paso was hazy from outflow windblown dust. Below is an animation of the accumulated rainfall from the Santa Teresa weather radar from 16 to 03 UTC (10 am to 9am). Based on CoCoRaHS observers, a few locations in Las Cruces measured rain. However no measurable rainfall fell on the NMSU campus at our NWS Coop station.


Very dry soils remain a problem for agriculture, air quality and wildlife (just to name a few) in the border region as shown in the soil moisture map below. The darkest red shades highlight soil percentiles below the 2nd percentile.
Wildfires continue to impact the border area with smoke from the Silver Fire travelling eastward across Sierra and northern Otero counties. Some smoke has impacted other areas to the south during the night hours when winds are light and channeled mainly by topography. Below is a NOAA GOES visible satellite image at 5:32 pm. There are also smoke plumes traveling northeastward from the mountains in NE Sonora Mexico.
By 6:30pm smoke plumes can be seen below spreading over most of northern Dona Ana, Sierra, and into Otero counties. Based on the brightness from this visible image, there might have been some pyrocumulus generated from the Silver Fire in the Black Range. Smoke from fires in Mexico look to impact central Hidalgo over the bootheel and potentially Deming and Lordsburg overnight.


Thursday, June 6, 2013

June 6 - Haze over southwestern NM

I woke up to a hazy view of the Organ Mountains today from my balcony in Las Cruces. I was in a rush this morning to get in early to prepare for a day in the field so I didn't get a photo. I wish I did. The haze was thick with estimate visibility of around 5 miles or so. I didn't smell smoke so that was eliminated. Looking at the dewpoint temperatures in the low 40s and RH in the 30% range ruled out a haze due to water droplets. Next I looked at the GOES IR image for this morning and that provided a real clue as to where the haze likely came from. Below was the 1302 UTC infrared image and you can see the remnants of the storm in the Panhandle of Texas. Earlier in the morning it was over eastern NM. Looking at an animation of the overnight images you can faintly see an outflow boundary coming from that cell. The radar reflectivities also shows that boundary and likely haboob moving across NM. Since it was overnight you can't see it and nobody was looking for it.
The backtrajectories generated this morning also supports a transport from eastern NM to Las Cruces overnight.
I spent the day in the Columbus and Deming area and it was hazy there as well.

Wednesday, June 5, 2013

June 4 - Another thunderstorm outflow haboob

Around 8 pm another haboob rolled through Las Cruces bringing in thick dust just after sunset. The photo below is from 8:39 pm looking south from Highrange.

Monday, June 3, 2013

June 3 -

Yesterday's (Sunday) haboob that blew through Las Cruces was spectacular in that I didn't really expect a distinct wall of dust. I was watching the radar echoes of the outflow boundary around 6:30 pm and noticing it move northward. The photo below was snapped at 6:57 pm as it crossed over A-Mountain and the southern part of Las Cruces.
We've uploaded to YouTube a time lapse of the haboob from the same location but looking directly south. YouTube timelapse. This haboob is not a spectacular as the ones in Phoenix but it's the most dramatic I've seen in Las Cruces. The video is a little shaky since I had to hold down the tripod during the high winds to keep it from blowing away. The surface weather map at 00 UTC (6 pm) showed winds from the south and high dewpoints to our east.
 The haboob showed up very clear on the weather radar and you can watch for yourself the progress of it by clicking on the animation below. The haboob boundary shows up as the string-like line moving from the south toward the north through the animation.
 
As a bonus, I show a plot of lidar backscatter from our ceilometer located just west of the NMSU campus. The plot shows that the leading edge of the haboob extends to about 700 meters above the ground. As expected the highest backscatter levels and likely highest particle concentrations are near to the ground. Impacts of the haboob also continued for more than 3 hours but the most dense part lasted about an hour.

Wednesday, April 17, 2013

April 17 - What a day along the border! Not just another dust storm but one that lasted more than 12 hours.

At 9 am: Winds are forecasted in Las Cruces area to be in the 31 to 41 mph range in the afternoon with gusts up to 55 mph. The time series plot below is based on the 13-km resolution Rapid Refresh model at a grid cell in Las Cruces for wind speed today. Winds should peak at 23 UTC.
 Below is a color shaded wind speed forecast for 22 UTC today.
As of 7pm, this dust storm is a whopper. I-10 has been close since noon and the winds and dust plumes have not let up. Below a NMDOT truck blocks the entrance to the frontage road that runs along I-10 near the Las Cruces Airport. A State Police cruiser blocked the entrance to I-10. I talked to the NMDOT worker who was directing traffic here and he said that there are locations down the road that have zero visibility. He also mentioned he exchanged words with some disgruntled travelers from 'back east' who didn't understand the dangers of driving along this stretch of highway. State Police had ultimate say on when the road will open up.
Hundreds of trucks and cars line both I-10 and side-roads as they wait for the interstate to open.
Below is another videocast of today's dust storm as seen from GOES, courtesy of NCAR RAP webpage.
 
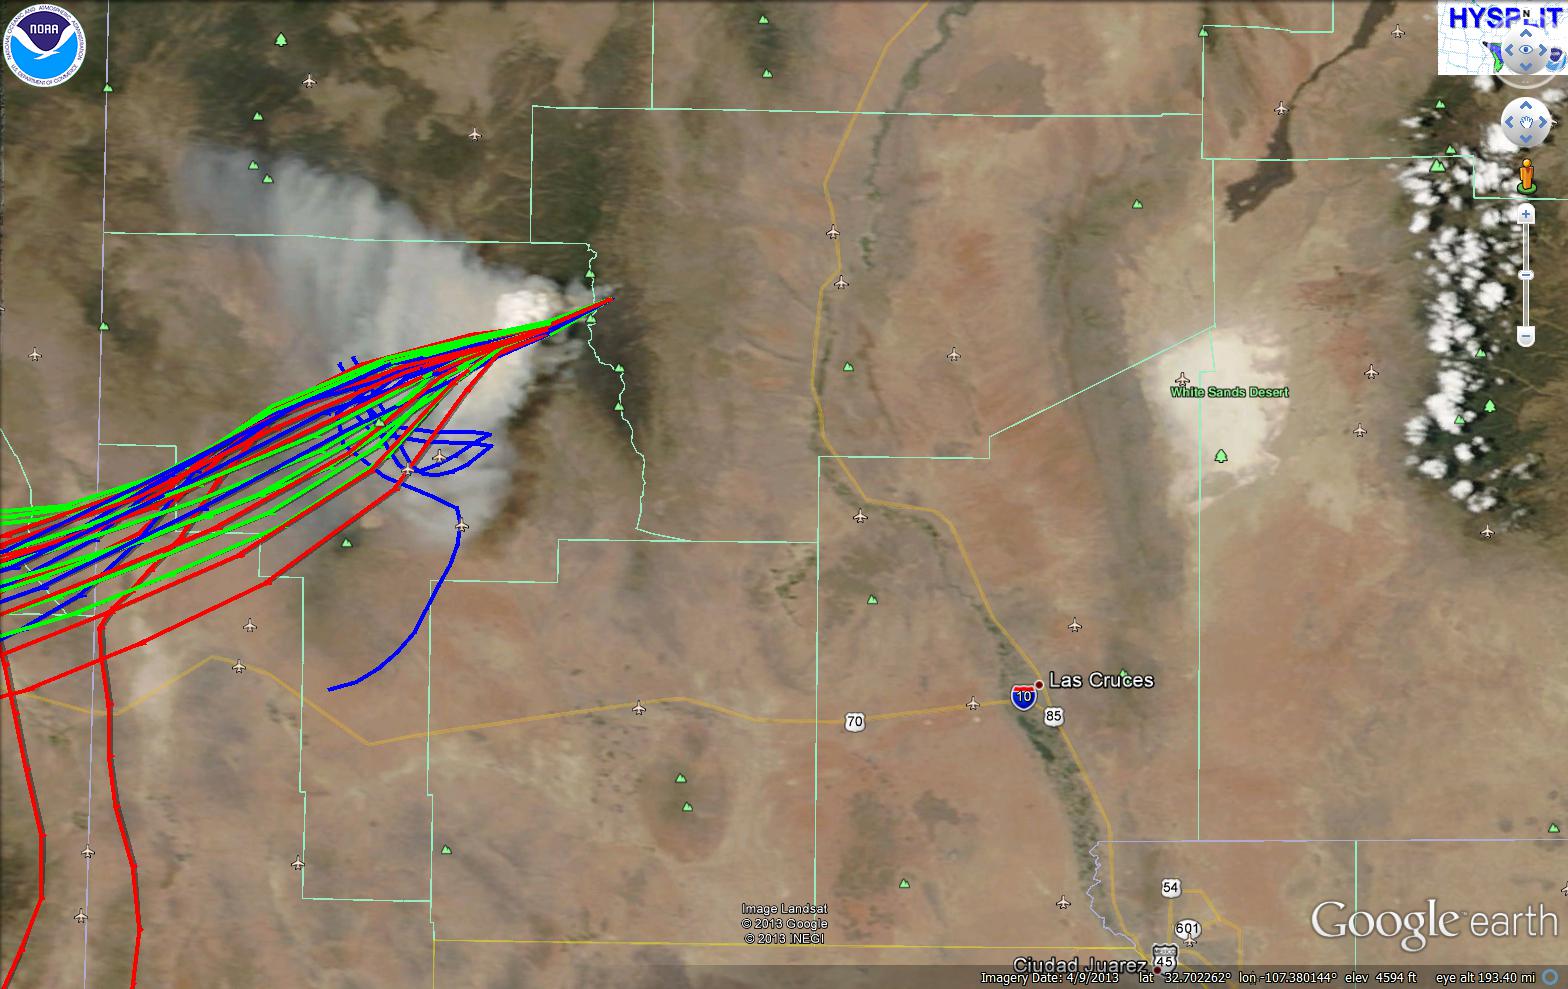
Another look at the storm from the GOES sounder longwave difference product provides some more information. As I mention in the videocast, a distinct New Mexico hot spot is clear in the looping images.
Below is a view southwestward from the Las Cruces Airport at 5 pm. As I expected this area is not a likely source area for the dust. A few construction areas on the way to the airport were causing some localized dust but not a lot.
A quick look at surface particulate matter concentrations shows very high concentrations of PM10 in Deming in the afternoon. Peak hourly PM10 nearly hit 3000 ug/m3 at 1 pm and again at 4 pm .
Below are the PM10 concentrations measured at the Las Cruces West Mesa station today. Peak PM10 was nearly 3000 ug/m3 this afternoon.What is interesting is that the dust started to increase about the same time as in Deming, with Deming reaching the peak earlier.
We installed the CL31 ceilometer on top of the monitoring trailer so we'll be showing some products from that soon. I just received the unit on Monday after being used in a year-long project in Sparks, NV for investigating high PM2.5 exceedances. I glanced at the backscatter profiles at around 6:30 pm and it was showing most of the dust confined to a layer about 800 meters thick. As expected the highest levels were near the ground.

By the end of the day, particulate concentrations decreased to pre-storm levels. Below is a summary of hourly PM10 across the New Mexico monitoring stations. The Las Cruces Holman station recorded the highest hourly value of 3977 ug/m3. The 24-hour average PM10 at that location was 557 ug/m3, which is about 3.7 times the EPA standard.
Peak hourly PM2.5 were nearly 200 ug/m3 across all stations in southern NM.  Highest 24-hour averaged PM2.5 was at the Sunland Park Desert View Elementary School station with a 90 ug/m3 concentration.


Tuesday, April 16, 2013

April 16 - another dusty afternoon

As seen in the annotated image below we saw more dust out of the Four Corners region and some activity in the southwest border region.


Monday, April 15, 2013

April 15, 2013 - Tax day dust

As expected, dust was flying somewhere in the border region on tax day. It seems to be the tradition. It looked like the highest dust concentrations were observed in far southern Dona Ana County this morning. I looked at the Sunland Park city yard station and the concentrations were around 500 ug/m3 at 9 am.

Here is an annotated briefing of dust around the state based on GOES images from the NCAR RAP website. Turn your speakers on for this one as I am describing the locations of the plumes.

Friday, March 8, 2013

March 8, 2013

Dust storm in the afternoon today. Our NMSU webcam showed the dust arriving on campus around 4 pm today. Peak PM10 was 1560 ug/m3 at 5 pm and stayed near 1000 through 7 pm. PM2.5 was over 100 ug/m3 over the same three hours. Below is a view from our Skeen Hall webcam through 9 pm tonight.


Sunday, February 24, 2013

Feb. 24 -
High winds are expected across the NM border later today. The NWS is predicting gusts up to 47 mph. Soils remain dry in most of the dust source areas. The last rain event didn't do much to keep soils moist.
As of 4:30pm dust is still dense over Las Cruces and points along the border and east. The 4:15 pm GOES image below shows the dust inundating much of southern NM and West Texas.


Saturday, February 9, 2013

Feb. 9 - Dust storm

The conditions were right for another dust storm over the border region today. Based on a reports from the National Weather Service here are a few peak wind gusts in each county affected: In Dona Ana County at San Augustin Pass 75 mph, 71 mph in North El Paso, 41 mph at the Redrock RAWS in Grant County, 46 mph at a station near Rodeo in Hidalgo County, 53 mph at the Deming airport, 60 mph near Sunspot, and 70 mph on Salinas Peak on WSMR in Sierra County. This storm was well forecasted since early in the week and the NWS mentioned dust early in the forecasts. The photo was snapped at 12:43 pm and shows the level of haze over Las Cruces. Normally you could see the top of the Hotel Encanto from this view at 2.24 km but the haze totally obscured it.
Around the region dust concentrations were very high. Below shows hourly PM10 collected at the Deming airport station operated by NMED. Peak hourly PM10 was 1863 ug/m3 at 10 am.
Hourly PM10 at the Anthony Elementary School peaked at 3265 ug/m3 at noon today.  Hourly PM2.5 was 221 ug/m3 at the same time.

The morning MODIS image onboard the Terra satellite showed very distinct dust plumes from areas in Chihuahua and White Sands. There was also evidence for some dust coming off of areas in northeastern Luna County as well. I saw this source in Luna County emitting at the last dust storm.
Supporting our project's emphasis on bioaerosols we collected samples during this event from a 6-stage cascade impactor. Using this sampler we investigate the fungal content of the dust in six size ranges.
We also measured a peak aerosol optical depth of 0.38 at 530 nm wavelength just after 1:30 pm  this afternoon. This was measured using a single band sun photometer that we built. This was the highest AOD measured this year. This matches the GOES AOD product for this afternoon.