Feb. 27 and 28 - dust event days
Both February 27th and 28th were dusty days with active weather patterns bringing dust to the border lands.
The upper level pattern for February 27 shows a trough approaching from the west and centered off-shore of California.
February 27 started off with road closures in southeast Arizona along interstate 10. Below are snapshots of tweets from AZ DOT and the NWS office in Tucson.
EPA's AQI forecast for today and tomorrow reflect the high winds
The forecast for tomorrow (Feb. 28) is showing blowing dust over a third of the state.
Our team is off to the Arizona dust workshop in the afternoon so we will find out what roads are closed first hand.
By the time we arrived in Lordsburg, the road through I-10 in Arizona was open to traffic. That gave us an opportunity to stop by the Lordsburg playa to download a few camera memory cards before the Arizona dust meeting.
February 28, 2017
We overnighted in Casa Grande, Arizona and attended the AZ dust workshop from 8:30 am to 12:30 pm on the campus of Central Arizona College, Coolidge, AZ.
The upper level trough moved eastward and in a position that nornmally see dust storms in the Chihuahuan Desert.
At the surface a cold front moves through the region.
By the afternoon, our satellite products started to pick up dust plumes in Mexico. The animation below is from GOES sounder in the longwave spectral region
and a view from GOES in the visible spectrum.
By noon the dust plumes were clearly visible on the VIIRS dust product from NASA SPoRT. The dust plumes show up as the pink shades.
Tuesday, February 28, 2017
Thursday, February 23, 2017
Feb. 23, 2017 dust storm over the Chihuahuan Desert and beyond
An upper level low centered over the Great Basin
and associated cold front
brought high winds and low humidity to the border region today. High winds were felt across most of Arizona, New Mexico, Texas and northwestern Chihuahua. The NMED station at the Deming airport gusted to 44 mph, the El Paso airport reached 51 mph and the weather station at San Augustin Pass gusted to 81 mph. Dust was just starting to be detected around noon from the VIIRS sensor aboard the Suomi polar orbiting satellite.
By 2 pm mountain time the dust plumes were clearly visible from the VIIRS dust product and highlighted in bright pink. Multiple dust source areas can be identified across northwestern Chihuahua. You can also see a dust plume developing from the Willcox playa in southeastern Arizona in the image below.
There were numerous impacts reported from the media from both the high winds and limited visibility from the blowing dust. There was a media report of a trailer overturned on highway 60 in New Mexico. I was monitoring the dust over the Lordsburg playa on I-10 starting in the morning and noticed a lot of dust activity starting around noon mountain time using the NMroads.com app on my iPad. I grabbed multiple frames from the mile marker 11 camera between 12:05 to 12:46 pm MST and put them together in an animation below. You can see at the beginning of the animation practically zero visibility and clearing up a few minutes later. Apparently an accident occurred at the start of the sequence and can see trucks parked on the left side of the image.
The mile marker 12 camera also shows the dust from the playa a mile to the east of the above animation.
You can see the line of traffic as the road was closed for a while in the above animation. As I mentioned earlier the event covered the whole region and into the southern Great Plains. I grabbed the GOES aerosol optical depth product from the Idea website and shows the extent of the dust today. Dense dust shows up in the warmer colors and thinner dust optical depth as light blue to turquiose.
An upper level low centered over the Great Basin
and associated cold front
brought high winds and low humidity to the border region today. High winds were felt across most of Arizona, New Mexico, Texas and northwestern Chihuahua. The NMED station at the Deming airport gusted to 44 mph, the El Paso airport reached 51 mph and the weather station at San Augustin Pass gusted to 81 mph. Dust was just starting to be detected around noon from the VIIRS sensor aboard the Suomi polar orbiting satellite.
By 2 pm mountain time the dust plumes were clearly visible from the VIIRS dust product and highlighted in bright pink. Multiple dust source areas can be identified across northwestern Chihuahua. You can also see a dust plume developing from the Willcox playa in southeastern Arizona in the image below.
There were numerous impacts reported from the media from both the high winds and limited visibility from the blowing dust. There was a media report of a trailer overturned on highway 60 in New Mexico. I was monitoring the dust over the Lordsburg playa on I-10 starting in the morning and noticed a lot of dust activity starting around noon mountain time using the NMroads.com app on my iPad. I grabbed multiple frames from the mile marker 11 camera between 12:05 to 12:46 pm MST and put them together in an animation below. You can see at the beginning of the animation practically zero visibility and clearing up a few minutes later. Apparently an accident occurred at the start of the sequence and can see trucks parked on the left side of the image.
The mile marker 12 camera also shows the dust from the playa a mile to the east of the above animation.
You can see the line of traffic as the road was closed for a while in the above animation. As I mentioned earlier the event covered the whole region and into the southern Great Plains. I grabbed the GOES aerosol optical depth product from the Idea website and shows the extent of the dust today. Dense dust shows up in the warmer colors and thinner dust optical depth as light blue to turquiose.
Monday, March 28, 2016
March 23, 2016 dust episode
Following the March 22 high wind day, the next day proved to be a potent dust day along the border.
Based on a summary of maximum wind gusts from the National Weather Service this event was similar in strength.
Dust source areas (pink color in map) in southwest New Mexico and Mexico showed up in today's 1:44pm MDT VIIRS dust product image from NASA SPoRT.
Some of the same dust source areas on the previous day were also emitting today. However on this day the wind direction was from the northwest pushing dust toward the southeast.
Following the March 22 high wind day, the next day proved to be a potent dust day along the border.
Based on a summary of maximum wind gusts from the National Weather Service this event was similar in strength.
Dust source areas (pink color in map) in southwest New Mexico and Mexico showed up in today's 1:44pm MDT VIIRS dust product image from NASA SPoRT.
Some of the same dust source areas on the previous day were also emitting today. However on this day the wind direction was from the northwest pushing dust toward the southeast.
Labels:
cold front,
dust,
extreme weather,
High wind event
March 22, 2016 dust event
A strong synoptic dust storm impacted most of the border country on March 22 and 23. High winds started early on the 22nd across the region and peaked late in the afternoon.
Traffic cameras along I-10 recorded times of near-zero visibility in the afternoon. The cameras west of Lordsburg showed episodes of blowing dust from the playa or dry lakebed. At the peak of the dust storm at about 4:11 am MDT the mile marker 11 camera (view toward the west) looked like this.
A few minutes later at 4:14 pm visibility increased a little but still a dangerous situation
The National Weather Service summarized the peak wind gusts and part of that statement is shown below. Click on it to view it. Peak winds at the Lordsburg playa were recorded at 61 mph at 4:49 pm/ In Deming winds gusted to 46 mph at 5:13 pm.
From satellite the dust could be seen from sources in New Mexico, Arizona, and Mexico. Below is an animated GIF of dust plumes as seen from NOAA GOES satellite of this afternoon.
A strong synoptic dust storm impacted most of the border country on March 22 and 23. High winds started early on the 22nd across the region and peaked late in the afternoon.
Traffic cameras along I-10 recorded times of near-zero visibility in the afternoon. The cameras west of Lordsburg showed episodes of blowing dust from the playa or dry lakebed. At the peak of the dust storm at about 4:11 am MDT the mile marker 11 camera (view toward the west) looked like this.
A few minutes later at 4:14 pm visibility increased a little but still a dangerous situation
The National Weather Service summarized the peak wind gusts and part of that statement is shown below. Click on it to view it. Peak winds at the Lordsburg playa were recorded at 61 mph at 4:49 pm/ In Deming winds gusted to 46 mph at 5:13 pm.
From satellite the dust could be seen from sources in New Mexico, Arizona, and Mexico. Below is an animated GIF of dust plumes as seen from NOAA GOES satellite of this afternoon.
Labels:
cold front,
dust,
extreme weather,
High wind event
Saturday, March 12, 2016
March 12, 2016 Forecasted dust
An upper level low travels through the border region today and is expected to bring in high winds. The National Weather Service is forecasting blowing dust starting around 11 am MST on Saturday. The graphical weather forecast is shown below for 11am MST
As of 9 am MST the forecasted winds in Las Cruces, NM were"Windy, with a west wind 16 to 26 mph increasing to 28 to 38 mph in the afternoon. Winds could gust as high as 55 mph." The soils along the border are likely very dry so the forecast of blowing dust appears appropriate.
Post event analysis
By 12:50 pm MST, dust sources in Chihuahua were active and dust plumes could be seen moving toward the ENE direction south of El Paso. Below is an image from NASA's VIIRS dust product that I obtained from their SPoRT webpage. In this product, dust shows up as bright pink. I brought the image into Google Earth and added the text.
By 3:30 pm MST, I could clearly (at least from my eyes) see dust plumes across Luna and Dona Ana Counties. One particular dust source west of Hatch was one that it unusual. Below is an image that I created based on 4-km GOES infrared channel 4 and highlighted the dust in light red over a tan background. The red over the mountains was clouds and not dust. The inset image is from Google Earth and shows what the landcover looks like near the dust source area.
A few dust plumes appeared on the DOT cameras operating on I-10 in Hidalgo county. I was monitoring the mile marker 11 and 12 cameras on Saturday and plumes appeared to be the typical "here one moment, gone the next" types. Here are a couple that I grabbed from nmroads.com website.
An upper level low travels through the border region today and is expected to bring in high winds. The National Weather Service is forecasting blowing dust starting around 11 am MST on Saturday. The graphical weather forecast is shown below for 11am MST
As of 9 am MST the forecasted winds in Las Cruces, NM were"Windy, with a west wind 16 to 26 mph increasing to 28 to 38 mph in the afternoon. Winds could gust as high as 55 mph." The soils along the border are likely very dry so the forecast of blowing dust appears appropriate.
Post event analysis
By 12:50 pm MST, dust sources in Chihuahua were active and dust plumes could be seen moving toward the ENE direction south of El Paso. Below is an image from NASA's VIIRS dust product that I obtained from their SPoRT webpage. In this product, dust shows up as bright pink. I brought the image into Google Earth and added the text.
By 3:30 pm MST, I could clearly (at least from my eyes) see dust plumes across Luna and Dona Ana Counties. One particular dust source west of Hatch was one that it unusual. Below is an image that I created based on 4-km GOES infrared channel 4 and highlighted the dust in light red over a tan background. The red over the mountains was clouds and not dust. The inset image is from Google Earth and shows what the landcover looks like near the dust source area.
A few dust plumes appeared on the DOT cameras operating on I-10 in Hidalgo county. I was monitoring the mile marker 11 and 12 cameras on Saturday and plumes appeared to be the typical "here one moment, gone the next" types. Here are a couple that I grabbed from nmroads.com website.
Monday, August 24, 2015
Wildfire impacts continue
This morning's backtrajectory model run shows that the border region to receive more smoke from California but not as intense.The map below shows the majority of the imported air to Las Cruces coming from central Arizona and then areas to the southwest.
There remains remnants of the smoke from the past week in the south central states. The image below shows the aerosol optical depth from the MODIS instrument aboard the Terra satellite. Areas of smoke are shown in red to light blue. While most of the thick smoke remains in Idaho and Montana, there is still a lot continuing to flow south through Wyoming and Colorado.
This morning's backtrajectory model run shows that the border region to receive more smoke from California but not as intense.The map below shows the majority of the imported air to Las Cruces coming from central Arizona and then areas to the southwest.
There remains remnants of the smoke from the past week in the south central states. The image below shows the aerosol optical depth from the MODIS instrument aboard the Terra satellite. Areas of smoke are shown in red to light blue. While most of the thick smoke remains in Idaho and Montana, there is still a lot continuing to flow south through Wyoming and Colorado.
Smoke from California fires
Over the past few days we have been seeing smoke drifting in from the wildfires burning in California, Oregon and Washington.
Today, August 23, a light haze covered Las Cruces most noticeable in the afternoon. The photo below was taken at 6:48 pm.
I think most of the haze is from the California fires rather than those from Washington and Oregon. I ran a Hysplit model backtrajectories from Las Cruces and it shows most of the air reaching us came from areas to our west and northcentral California. This particular map below shows the pathways of air going back 7 days from Sunday afternoon, August 23. The different colors are from the model run in ensemble mode that represents variability in the atmosphere.
Up in Albuquerque and northern NM, the smoke impacts appeared to be much more intense. The news reports on Sunday shows that the City of Albuquerque issued an air quality alert due to the smoke. I ran the same model but starting from Albuquerque and it showed the smoke coming from the fires in California.
Sunday afternoon, the satellite viewed high amounts of aerosols in the eastern part of the state, likely bringing in the smoke from Washington and Idaho along the boundary of the backdoor cold front. The image below shows total aerosol amounts as seen by the MODIS Aqua satellite. The yellow colors show amounts that are high. Normally, we seen mostly dark blue colors without fires.
Over the past few days we have been seeing smoke drifting in from the wildfires burning in California, Oregon and Washington.
Today, August 23, a light haze covered Las Cruces most noticeable in the afternoon. The photo below was taken at 6:48 pm.
I think most of the haze is from the California fires rather than those from Washington and Oregon. I ran a Hysplit model backtrajectories from Las Cruces and it shows most of the air reaching us came from areas to our west and northcentral California. This particular map below shows the pathways of air going back 7 days from Sunday afternoon, August 23. The different colors are from the model run in ensemble mode that represents variability in the atmosphere.
Sunday afternoon, the satellite viewed high amounts of aerosols in the eastern part of the state, likely bringing in the smoke from Washington and Idaho along the boundary of the backdoor cold front. The image below shows total aerosol amounts as seen by the MODIS Aqua satellite. The yellow colors show amounts that are high. Normally, we seen mostly dark blue colors without fires.
Thursday, July 9, 2015
Our group has been monitoring the dust west of Lordsburg on interstate 10 near the playa. Our remote cameras have been showing a few dust events that reminds me to be cautious when driving over that kind of landcover. I posted a clip from June 9 of this year on YouTube to show much of a problem that area is to motorists. What is troubling is the length of time that the dust obscured the road. In this case it lasted about 7 minutes. The view looks east along the highway and is approximately the same area as the May 2014 accident that took lives.
Wednesday, July 8, 2015
July 7, 2015
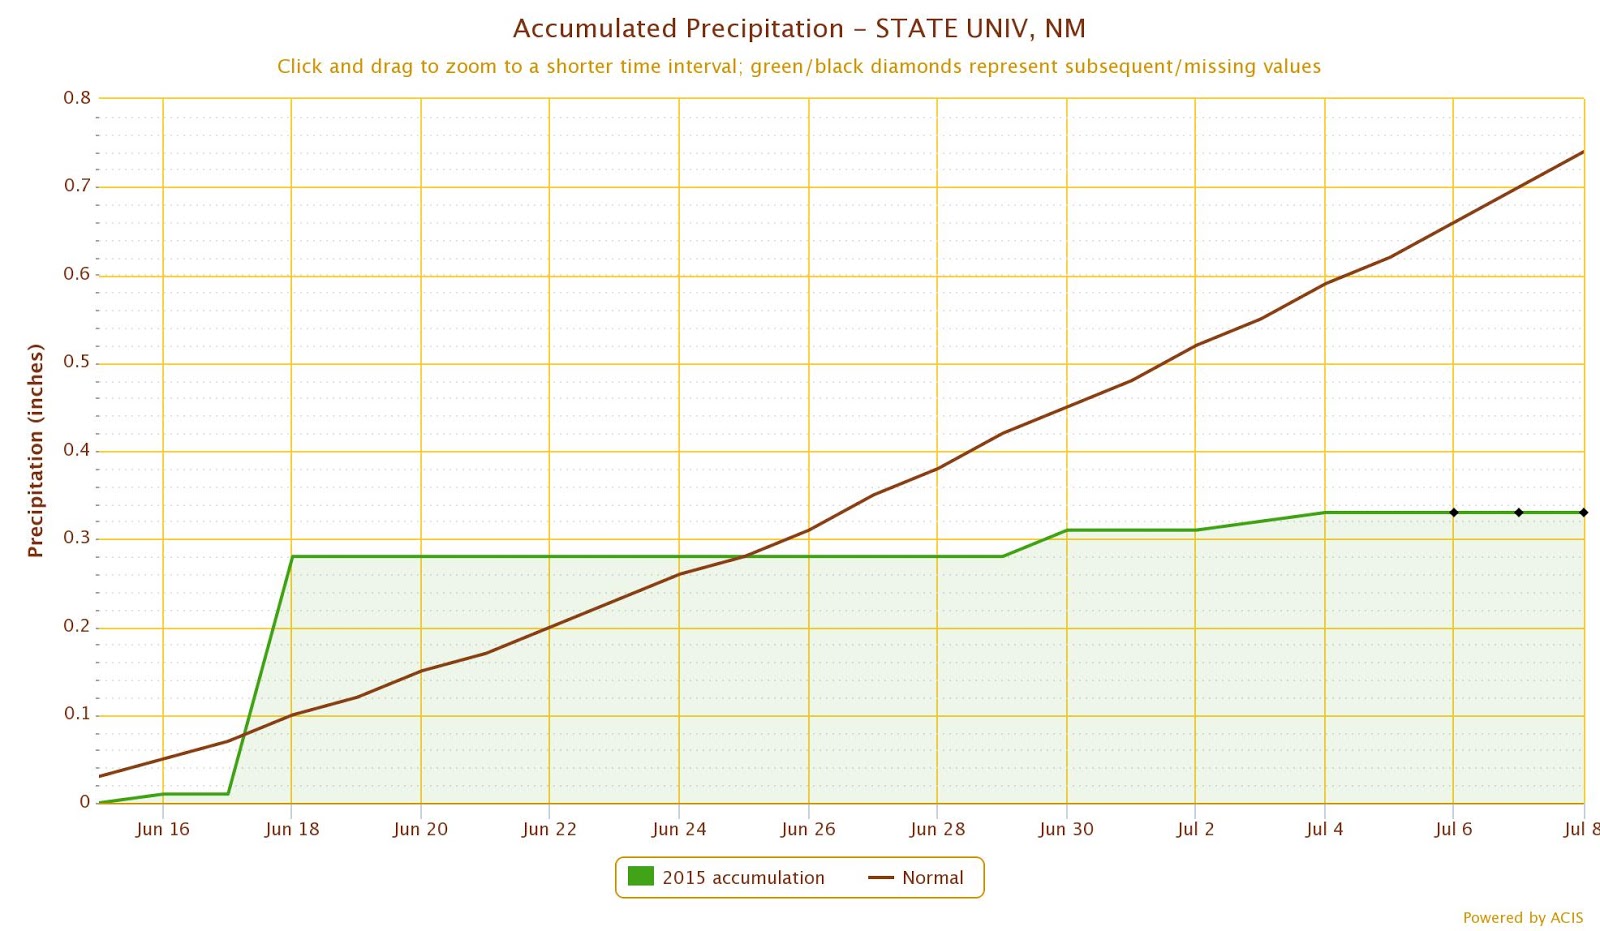
So far the monsoon precipitation has been above average for most of the state of New Mexico but below average in a few places in southern part of the state. The monsoon "season" officially started in June 15 and at Las Cruces station at NMSU recorded 0.33 inches of precipitation. This is in comparison to the long term average of 0.74 inches.
With this precipitation deficit, we are bound to see dry soils and dust when thunderstorms blow through the area. Today was one of those cases and we saw brief but high winds during thunderstorms in the afternoon. I took the photo below at 3:51 pm standing on the Las Cruces dam vista.
This was caused by a thunderstorm outflow and can easily be seen in the weather radar. I highlighted the outflow boundary in yellow and the arrow shows the direction of movement.
So far the monsoon precipitation has been above average for most of the state of New Mexico but below average in a few places in southern part of the state. The monsoon "season" officially started in June 15 and at Las Cruces station at NMSU recorded 0.33 inches of precipitation. This is in comparison to the long term average of 0.74 inches.
With this precipitation deficit, we are bound to see dry soils and dust when thunderstorms blow through the area. Today was one of those cases and we saw brief but high winds during thunderstorms in the afternoon. I took the photo below at 3:51 pm standing on the Las Cruces dam vista.
This was caused by a thunderstorm outflow and can easily be seen in the weather radar. I highlighted the outflow boundary in yellow and the arrow shows the direction of movement.
Wednesday, May 13, 2015
Tuesday, May 12 was full of weather action along the border. Along the east side of the region from Deming to Sacramento Mountains, we saw heavy rain and brief wind gusts. Along the west side near Lordsburg I noticed blowing dust near I-10.
I captured multiple images from the NM DOT cams at nmroads.com and created a brief animation. The first one is from mile marker 12 on interstate 10.
The second animation is from mile marker 11.
I captured multiple images from the NM DOT cams at nmroads.com and created a brief animation. The first one is from mile marker 12 on interstate 10.
Sunday, May 10, 2015
May 9, 2015
Despite above average precipitation in 2015 through most of New Mexico including the southwest part of the state, the soils are becoming dry west of Lordsburg at the playa. Over the winter most of the playa has been covered in water but over time it has been evaporating. During the spring we have seen dust from synoptic storms as well as from convective dry microbursts. On May 4th most of the dust at the playa was from dry microbursts that generated high winds. These winds were short lived but intense based on the traffic cams installed near the highway. A few days later on May 8th winds were elevated from a passing cold front at the same location. I've captured a few screen shots of the NM DOT cameras installed at mile marker 11 to show how the dust looks from the overpass at that location. I have similar animations from the cam at mile marker 12 but I'll show just the ones at mile marker 11 here.
May 4th dust events from mile marker 11. This camera looks west along I-10. Each frame of the animation is about 1 or 2 minutes apart. Notice the complete brown-out later in the animation.
May 8th dust events from the mile marker 11 camera.
When driving through scenes like these, please be very cautious and observe the rules of Pull aside, turn off lights, foot off the brake, and wait it out. The Arizona DOT has a very informative website for this.
Despite above average precipitation in 2015 through most of New Mexico including the southwest part of the state, the soils are becoming dry west of Lordsburg at the playa. Over the winter most of the playa has been covered in water but over time it has been evaporating. During the spring we have seen dust from synoptic storms as well as from convective dry microbursts. On May 4th most of the dust at the playa was from dry microbursts that generated high winds. These winds were short lived but intense based on the traffic cams installed near the highway. A few days later on May 8th winds were elevated from a passing cold front at the same location. I've captured a few screen shots of the NM DOT cameras installed at mile marker 11 to show how the dust looks from the overpass at that location. I have similar animations from the cam at mile marker 12 but I'll show just the ones at mile marker 11 here.
May 4th dust events from mile marker 11. This camera looks west along I-10. Each frame of the animation is about 1 or 2 minutes apart. Notice the complete brown-out later in the animation.
Wednesday, February 11, 2015
Tuesday, November 11, 2014
Nov. 10 - Haboob moved through northeastern New Mexico today along with a cold airmass
The animated sequence of satellite images below shows the path of the dust coming out of southeast Colorado and entering Union County, NM.
Visibility at the Clayton airport dipped to 4 miles at 6:55pm due to the dust while the winds were blowing 33 mph from the north with gusts to 44 mph. Dramatic changes in temperature also were observed in that area. At Clayton the temperature at 2:55pm was 77F and by 6:55pm it was at the freezing point, for a drop of 45F over a 4 hour period.
The animated sequence of satellite images below shows the path of the dust coming out of southeast Colorado and entering Union County, NM.
Wednesday, April 30, 2014
April 30 - Dust storm Irina brings in haze to the border area today
Yesterday high winds lofted dust from the Texas Panhandle as seen from satellite. Below is an image from the VIIRS SPoRT dust product. The pink area clearly identifies the dust that was generated from the storm.
Winds overnight transported some of this dust from the Panhandle to much of New Mexico and the border region. This morning's dust over Las Cruces was transported across west Texas and up toward the Panhandle overnight as the Hysplit plot below shows.
At 8am this morning haze has blanketed Las Cruces and remains in the air through the afternoon. The photo below is looking east toward the Organ Mountains from Las Cruces.
I expect the dust to linger even with a modest wind today. The plot below shows Hysplit backtrajectories from various locations in the NM and AZ for 3pm this afternoon will continue to bring in haze.
Yesterday high winds lofted dust from the Texas Panhandle as seen from satellite. Below is an image from the VIIRS SPoRT dust product. The pink area clearly identifies the dust that was generated from the storm.
At 8am this morning haze has blanketed Las Cruces and remains in the air through the afternoon. The photo below is looking east toward the Organ Mountains from Las Cruces.
I expect the dust to linger even with a modest wind today. The plot below shows Hysplit backtrajectories from various locations in the NM and AZ for 3pm this afternoon will continue to bring in haze.
As of noon a dust source in Chihuahua that looks to be east of the NM Bootheel is emitting dust. Winds are transporting it in a west northwest direction. Below is a GOES sounder longwave difference image at 12:02pm with the dust showing up in deep red and purple.
By 1pm the Mexican/Bootheel dust plume traveled into Arizona's Chiricahua Mountains and probably impacting I-10. Below is the VIIRS dust product from SPoRT at 1:41pm MDT.
As of 3pm the haze lingers in southern NM but cleared up slightly probably due to daytime mixing and deeper mixed layer. Below is a shot from San Augustine Pass at 2:30pm looking toward the Sacramento Mountains and Tularosa Basin to the east.
Monday, April 28, 2014
April 28 - Dust storm 'Helen' event summary
A particularly deep upper level trough has caused a couple of exceptional dust events to the border region this past weekend.
Below is a longwave difference animation that I recorded from the RAMSDIS webpage that shows the dust this morning looping around the low. Areas of dust show up as the deep red to violet.
The dust source area also shows up on the VIIRS dust product from SPoRT. This was image was captured at 3pm mountain time.
A particularly deep upper level trough has caused a couple of exceptional dust events to the border region this past weekend.
Below is a longwave difference animation that I recorded from the RAMSDIS webpage that shows the dust this morning looping around the low. Areas of dust show up as the deep red to violet.
The dust source area also shows up on the VIIRS dust product from SPoRT. This was image was captured at 3pm mountain time.
Wednesday, August 21, 2013
Aug. 21 - Haze hits the borderland today
If you looked outside this afternoon and looked up you would have noticed a light haze. Particularly noticeable later in the afternoon with the setting sun. A quick run of the Hysplit model in the backward mode showed the source region of the haze. Below is a backtrajectory map from Las Cruces examining the air 5 days in the past. The past 24-hour showed the air from the southeast along the Rio Grande. Going back even further the airmass made a turn along the path of the high pressure center and passed through the upper Midwest and through the northern Plains.
Knowing that there are numerous wildfires burning in the west and looking at the smoke plume analysis maps you can be fairly sure that the haze in our area is from those fires.
If you looked outside this afternoon and looked up you would have noticed a light haze. Particularly noticeable later in the afternoon with the setting sun. A quick run of the Hysplit model in the backward mode showed the source region of the haze. Below is a backtrajectory map from Las Cruces examining the air 5 days in the past. The past 24-hour showed the air from the southeast along the Rio Grande. Going back even further the airmass made a turn along the path of the high pressure center and passed through the upper Midwest and through the northern Plains.
Knowing that there are numerous wildfires burning in the west and looking at the smoke plume analysis maps you can be fairly sure that the haze in our area is from those fires.
Subscribe to:
Posts (Atom)